Figure 4-20 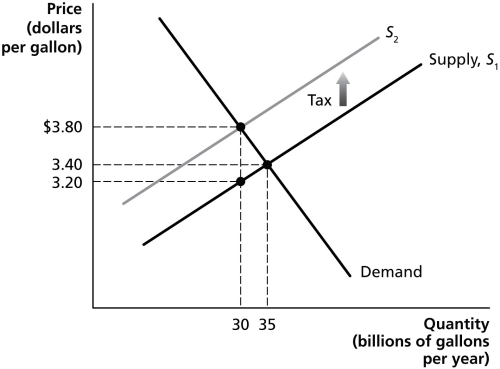
-Refer to Figure 4-20. The figure above represents demand and supply in the market for gasoline. Use the diagram to answer the following questions.
a. How much is the government tax on each gallon of gasoline?
b. What portion of the per-unit tax is paid by consumers?
c. What portion of the per-unit tax is paid by producers?
d. What is the quantity sold after the imposition of the tax?
e. What is the after-tax revenue per gallon received by producers?
f. What is the total tax revenue collected by the government?
g. What is the value of the excess burden of the tax?
Correct Answer:
Verified
b. Consumer bu...
View Answer
Unlock this answer now
Get Access to more Verified Answers free of charge
Q170: The government proposes a tax on halogen
Q175: The division of the burden of a
Q181: If a tax is imposed on a
Q185: An efficient tax is
A)a tax that imposes
Q186: Economists have shown that the burden of
Q189: One result of a tax is an
Q189: In the market for gasoline,an increase in
Q197: Article Summary
Voters in California approved a $2
Q200: The incidence of a tax depends on
Q370: Figure 4-19 ![]()
Unlock this Answer For Free Now!
View this answer and more for free by performing one of the following actions

Scan the QR code to install the App and get 2 free unlocks

Unlock quizzes for free by uploading documents