Essay
Table 1-7
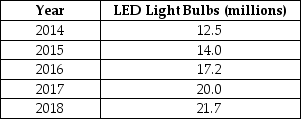
-Refer to Table 1-7. The table above shows the sales of LED light bulbs in North America. Present the information using a bar graph.
Correct Answer:
Verified
Related Questions
Q201: If the price of milk was $1.25
Q208: If a straight line passes through the
Q209: If a straight line passes through the
Q212: Suppose when the price of hybrid automobiles
Q214: The relationship between sales and revenue is
A)an
Q227: Figure 1-4 Q235: If the price of milk was $2.50 Q236: In 2017, Hooverville consumed 205,000 tons of Q441: Figure 1-6 Q445: Figure 1-5 Unlock this Answer For Free Now! View this answer and more for free by performing one of the following actions Scan the QR code to install the App and get 2 free unlocks Unlock quizzes for free by uploading documents
![]()
![]()
![]()

