The diagram below shows a plot of the temperature of the sun as a function of distance above the bottom of the photosphere.At what distance above the bottom of the photosphere does the temperature of the sun change the most rapidly with distance? 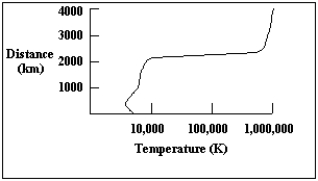
A) 1,000 km
B) 2,300 km
C) 2,500 km to 4,000 km
D) 500 km
E) a and c
Correct Answer:
Verified
Q1: Sunspots are known to be magnetic phenomena
Q3: Sunspots are dark because
A) regions of the
Q4: The corona of the sun can be
Q11: Granulation is caused by
A) sunspots.
B) rising gas
Q42: Modern astronomers suspect the corona is heated
Q42: _ occur(s) because photons we receive from
Q48: The energy generated by the sun is
Q50: Fusion is promoted in the core of
Q54: Most of the energy emitted by the
Q59: Neutrinos are created in reactions in the
Unlock this Answer For Free Now!
View this answer and more for free by performing one of the following actions

Scan the QR code to install the App and get 2 free unlocks

Unlock quizzes for free by uploading documents