The graph below depicts the cost structure for a firm in a competitive market.
Figure 9-13 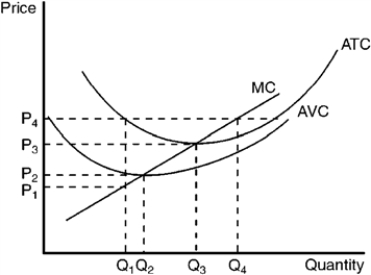
-Refer to Figure 9-13. When price rises from P3 to P4, the firm finds that
A) fixed costs are lower at a production level of Q4.
B) it can earn a positive profit by increasing production to Q4.
C) profit is still maximized at a production level of Q3.
D) average revenue exceeds marginal revenue at a production level of Q4.
Correct Answer:
Verified
Q84: Use the figure to answer the following
Q85: Use the figure to answer the following
Q86: Use the figure to answer the following
Q87: Use the figure to answer the following
Q88: Figure 9-12 Q90: Use the figure to answer the following![]()
Unlock this Answer For Free Now!
View this answer and more for free by performing one of the following actions

Scan the QR code to install the App and get 2 free unlocks

Unlock quizzes for free by uploading documents