Multiple Choice
Figure 3-22 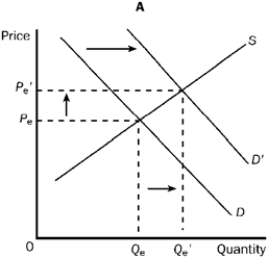
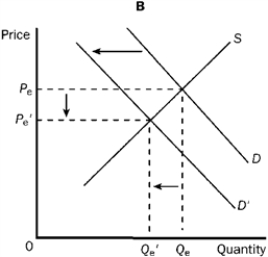
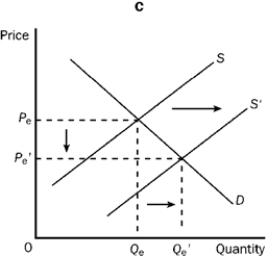
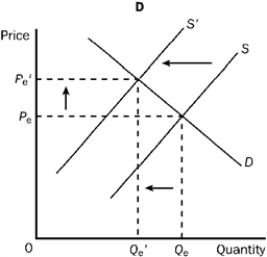
-Refer to Figure 3-22. Which of the four graphs represents the market for peanut butter after a major hurricane hits the peanut-growing south?
A) A
B) B
C) C
D) D
Correct Answer:
Verified
Related Questions
Figure 3-22
-Refer to Figure 3-22. Which of the four graphs represents the market for peanut butter after a major hurricane hits the peanut-growing south?
A) A
B) B
C) C
D) D
Correct Answer:
Verified

