Multiple Choice
Figure 3-23 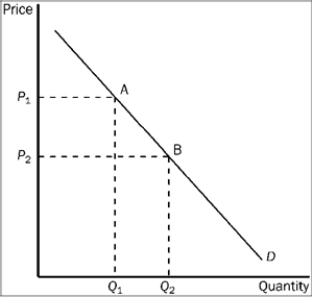
-Refer to Figure 3-23. The movement from point A to point B on the graph shows
A) a decrease in demand.
B) an increase in demand.
C) a decrease in quantity demanded.
D) an increase in quantity demanded.
Correct Answer:
Verified
Related Questions
Q131: Figure 3-22 ![]()

