Figure 10-8 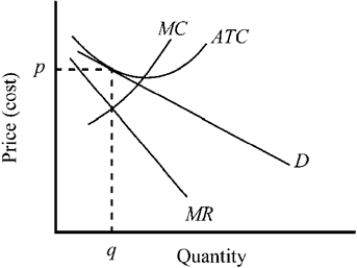
-Figure 10-8 presents the demand, marginal revenue, and cost curves for a typical firm in a market. This figure illustrates
A) short-run equilibrium in a competitive price-taker market.
B) long-run equilibrium in a competitive price-taker market.
C) short-run equilibrium in a competitive price-searcher market.
D) long-run equilibrium in a competitive price-searcher market.
Correct Answer:
Verified
Q85: Use the figure to answer the following
Q86: Figure 10-11 Q87: Use the figure to answer the following Q88: Use the figure to answer the following Q89: Use the figure to answer the following Q91: When you go to a grocery store, Q92: Figure 10-11 Q93: Use the figure to answer the following Q94: Figure 10-12 Q95: Use the figure to answer the following Unlock this Answer For Free Now! View this answer and more for free by performing one of the following actions Scan the QR code to install the App and get 2 free unlocks Unlock quizzes for free by uploading documents![]()
![]()
![]()

