 Figure 13-4A
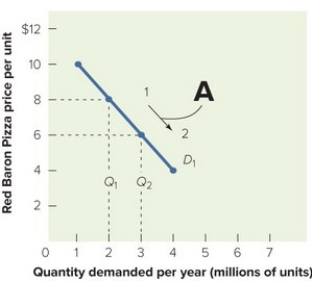
-Figure 13-4A above shows that when the price for Red Baron frozen cheese pizzas moves from $8 to $6 per unit along the demand curve D1, the quantity demanded
A) increases from 2 to 3 million units per year.
B) decreases from 3 to 2 million units per year.
C) stays the same.
D) increases from 6 to 8 million units per year.
E) decreases from 8 to 6 million units per year.
Correct Answer:
Verified
Q137: A demand curve graph typically appears as
A)
Q138: The maximum quantity of products consumers will
Q139: Q140: Demand factors are Q141: Several companies produce latex gloves that are Q143: Elastic demand exists when![]()
A) the various competitors that
A) a small percentage
Unlock this Answer For Free Now!
View this answer and more for free by performing one of the following actions

Scan the QR code to install the App and get 2 free unlocks

Unlock quizzes for free by uploading documents