Multiple Choice
The figure below is from an experiment on athletes. The "live high, train low" group lived for 18 days in rooms with a simulated altitude of 3,000 m, while training (exercising) at 1,200 m. Use this information and this figure to answer the following questions. 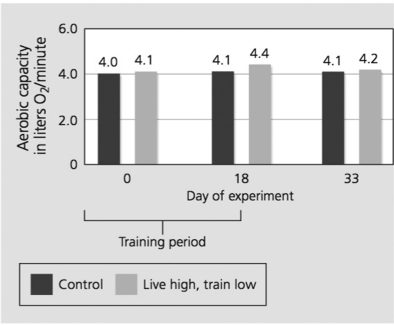
-What does the graph show about the experiment?
A) The increase in red blood cell production from living at a high altitude diminishes after returning to low altitude.
B) Living at high altitude does not have an effect on red blood cell production.
C) The increase in red blood cell production from living at a high altitude occurs from day 0.
Correct Answer:
Verified
Related Questions


