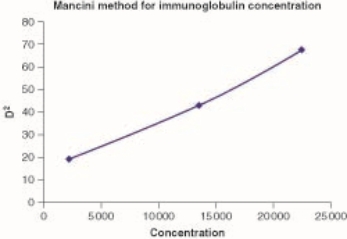
A) The graph in the figure shows the results of an endpoint incubation of an RID using the Mancini method to plot density squared (d2) versus concentration
B) The graph in the figure shows the results of an endpoint incubation of an RID using the Fahey method to plot d2 versus concentration
C) The graph in the figure shows the results of an endpoint incubation of an RID using the Mancini method to plot diameter squared versus concentration.
D) The graph shows none of the above.
Correct Answer:
Verified
Q17: When a mom and a dad have
Q18: Agglutination is
A)less sensitive than precipitation
B)more sensitive than
Q19: A plot of D2 versus concentration is
Q20: Nephelometry
A)is less sensitive than turbidimetry and is
Q21: Q23: To increase agglutination, we could Q24: To measure the amount of a small![]()
A)decrease viscosity of
Unlock this Answer For Free Now!
View this answer and more for free by performing one of the following actions

Scan the QR code to install the App and get 2 free unlocks

Unlock quizzes for free by uploading documents