The following figure shows studies in a stream where enclosures were set up either with trout or with no trout.Which statement is a correct interpretation of the graph about trout, invertebrates, and algae? 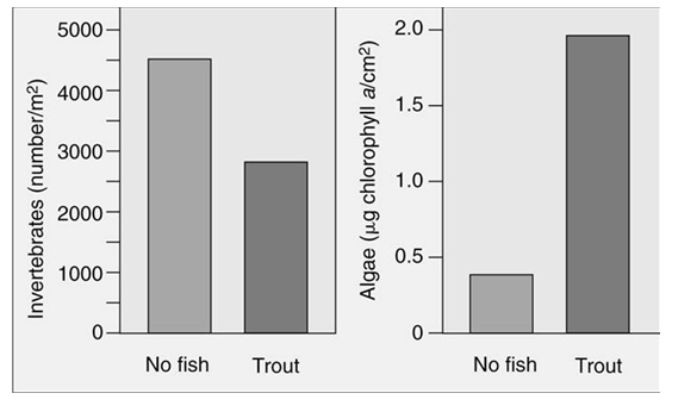
A) If trout are present in a system, algae production is low and invertebrate population levels are also low.
B) If trout are present in a system, algae production is high and invertebrate population levels are also high.
C) If trout are present in a system, algae production is high and invertebrate population levels are low.
D) Trout do not seem to affect the algae production; only the invertebrate populations are affected.
Correct Answer:
Verified
Q22: Addition of a primary carnivore to an
Q30: Which one of the following ecosystems is
Q31: In a food chain consisting of four
Q34: A good average value for the amount
Q36: The rate of production of new biomass
Q37: What feature do the carbon and nitrogen
Q38: In a marine ecosystem with an inverted
Q39: Which one of the following factors would
Q39: In the food chain below, what does
Q40: Energy enters most ecosystems by the process
Unlock this Answer For Free Now!
View this answer and more for free by performing one of the following actions

Scan the QR code to install the App and get 2 free unlocks

Unlock quizzes for free by uploading documents