The figure shows a graph of the resistance of a wire as a function of its length. What physical quantities does the slope of this graph represent? 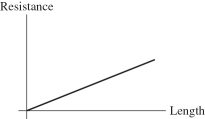
A) the cross-sectional area of the wire
B) the resistivity of the material of which the wire is made
C) the product of the resistivity and the cross-sectional area of the wire
D) the resistivity of the material divided by the cross-sectional area of the wire
E) the reciprocal of the resistivity of the material
Correct Answer:
Verified
Q1: If a quantity you calculated has units
Q3: For the graph shown in the figure,
Q5: If a quantity you calculated has
Q5: A wire of resistivity ρ must be
Q7: When current is flowing in an ordinary
Q9: The figure shows conventional current passing through
Q11: When a current flows through an ionic
Q11: For the graph shown in the figure,
Q13: The length of a certain wire is
Q17: Copper wire #1 has a length L
Unlock this Answer For Free Now!
View this answer and more for free by performing one of the following actions

Scan the QR code to install the App and get 2 free unlocks

Unlock quizzes for free by uploading documents