The figure shows a graph of the temperature of a pure substance as a function of time as heat is added to it at a constant rate in a closed container. If LF is the latent heat of fusion of this substance and LV is its latent heat of vaporization, what is the value of the ratio LV/LF? 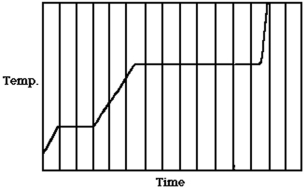
A) 5.0
B) 4.5
C) 7.2
D) 3.5
E) 1.5
Correct Answer:
Verified
Q2: A solid cylindrical bar conducts heat at
Q5: Object 1 has three times the
Q5: An object having a fixed emissivity of
Q8: Object 1 has three times the
Q8: Two metal spheres are made of the
Q10: On a cold day,a piece of metal
Q11: The process in which heat flows by
Q12: A thermally isolated system is made up
Q14: A thermally isolated system is made up
Q18: If you wanted to know how much
Unlock this Answer For Free Now!
View this answer and more for free by performing one of the following actions

Scan the QR code to install the App and get 2 free unlocks

Unlock quizzes for free by uploading documents