Multiple Choice
In the graph below six short-run average cost curves labeled a through f are illustrated.
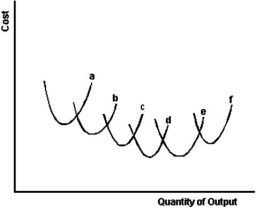
-Refer to the graph above to answer this question.Which set of short-run average cost curves illustrates diseconomies of scale?
A) a and b only
B) a,b and c only.
C) a,b,c,and d
D) d and e only.
E) e and f only.
Correct Answer:
Verified
Related Questions
Q54: In the graph below six short-run average
Q55: Under what circumstances does an increase in
Q56: In the graph below six short-run average
Q57: Assume that a firm's total cost of
Q58: Assume that a firm's total cost of
Unlock this Answer For Free Now!
View this answer and more for free by performing one of the following actions

Scan the QR code to install the App and get 2 free unlocks

Unlock quizzes for free by uploading documents