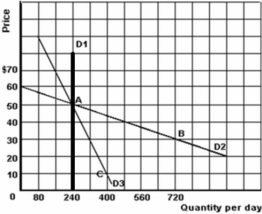
The graph below illustrates three demand curves.
-Refer to the graph above to answer this question.Which of the following statements is correct?
A) The price elasticity of demand between points A and B on D2 is 0.5.
B) D1 illustrates an inferior good.
C) The slope of all three demand curves is constant.
D) The shift from D1 to D2 could illustrate a change in the quantity demanded for a product as a result of a decrease in the price of a substitute good.
Correct Answer:
Verified
Q37: Q38: What do products such as movies,tomatoes and Q39: Q40: Suppose that the value of the price Q41: The list below refers to the price Q43: Which of the following statements is true Q44: The list below refers to the price Q45: The graph below illustrates three demand curves. Q46: The world's price of oil increased dramatically Q47: The list below refers to the price![]()
![]()
Unlock this Answer For Free Now!
View this answer and more for free by performing one of the following actions

Scan the QR code to install the App and get 2 free unlocks

Unlock quizzes for free by uploading documents