The graph below illustrates three demand curves.
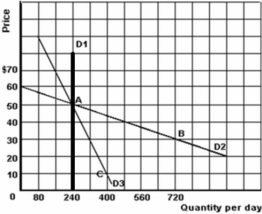
-Refer to the graph above to answer this question.Which of the following statements is correct?
A) The price elasticity of demand between points A and C on D3 is 0.267.
B) The price elasticity of demand between points A and C on D3 is 0.375.
C) The demand between points A and C on D3 is elastic.
D) The slope of demand curve D1 and its price elasticity are the same.
Correct Answer:
Verified
Q40: Suppose that the value of the price
Q41: The list below refers to the price
Q42: The graph below illustrates three demand curves.
Q43: Which of the following statements is true
Q44: The list below refers to the price
Q46: The world's price of oil increased dramatically
Q47: The list below refers to the price
Q48: The list below refers to the price
Q49: What is true about the price elasticity
Q50: Which of the following statements is most
Unlock this Answer For Free Now!
View this answer and more for free by performing one of the following actions

Scan the QR code to install the App and get 2 free unlocks

Unlock quizzes for free by uploading documents