Multiple Choice
The graph below illustrates three demand curves.
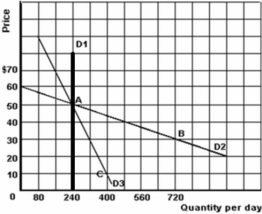
-Refer to the graph above to answer this question.Between the price range of $50 and $60,which of the three demand curves is the most elastic?
A) D1.
B) D2.
C) D3.
D) Cannot be determined.
Correct Answer:
Verified
Related Questions

