Multiple Choice
The graph below illustrates three demand curves.
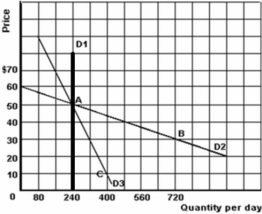
-Refer to the graph above to answer this question.In the $50 to $60 price range,which of the following statements is correct?
A) D1 and D2 are both elastic.
B) D1 and D2 are both perfectly inelastic.
C) D2 is the most inelastic.
D) D3 is the most inelastic.
E) D1 is the most inelastic.
Correct Answer:
Verified
Related Questions
Q61: Q62: Q63: Why do some people argue that attempts Q64: ![]()
![]()
![]()

