The figure below shows the market for blueberries in the country of Marblemont. 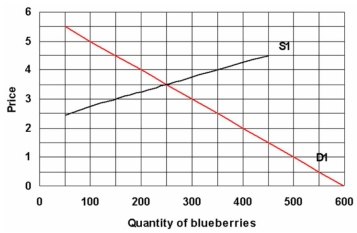 a) Graph an increase in supply of blueberries of 150 and a simultaneous decrease in demand of 150. Draw and label the new curves D2 and S2
b) What will be the new equilibrium price and quantity?
Correct Answer:
Verified
View Answer
Unlock this answer now
Get Access to more Verified Answers free of charge
Q13: What is a price floor? What happens
Q121: Assume X and Y are complementary goods.An
Q126: State whether each of the following is
Q131: Assume the market for coffee is initially
Q133: Distinguish between shortage and scarcity.
Q134: Assume the market for gasoline is initially
Q136: Distinguish between surplus and supply.
Q137: In each of the following cases,
Q139: If the demand for a product were
Q139: The figure below depicts the international market
Unlock this Answer For Free Now!
View this answer and more for free by performing one of the following actions

Scan the QR code to install the App and get 2 free unlocks

Unlock quizzes for free by uploading documents