Multiple Choice
The product is a normal product.
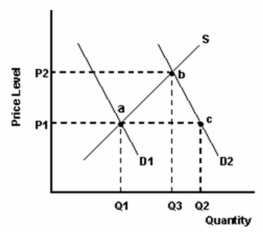
-Refer to the graph above to answer this question. What does the distance Q1 - Q2 represent?
A) An increase in the quantity demanded.
B) A surplus at price P1.
C) A shortage at price P1.
D) The result of a decrease in income.
Correct Answer:
Verified
Related Questions
Q61: The following table shows the initial weekly
Q64: The following table shows the initial weekly
Q67: The product is a normal product.
Q69: What is the effect of consumers' expecting
Q71: The product is a normal product.
Unlock this Answer For Free Now!
View this answer and more for free by performing one of the following actions

Scan the QR code to install the App and get 2 free unlocks

Unlock quizzes for free by uploading documents