The figure below illustrates the demand for electrical engineers. 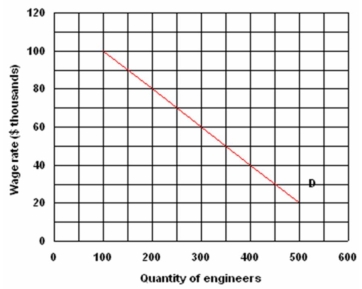 a) Draw in a supply curve that is a 45-degree line from the origin.
b) What are the total earnings per year of the engineers as a group?
c) How much of the earning are transfer earnings and how much are economic rent?
d) If the supply of engineers decreased, would the total earnings for the group increase or decrease?
Correct Answer:
Verified
b) $18 million (300 engine...
View Answer
Unlock this answer now
Get Access to more Verified Answers free of charge
Q113: How is MRP different for a monopolist
Q126: Differentiate between a monopoly and a monopsony.
Q129: Heavenly Bubbles is a small soap
Q130: Given the following data and assuming
Q130: Differentiate between a product market and a
Q134: Differentiate between marginal revenue and marginal revenue
Q136: Suppose that in the country of Gardenia
Q136: Demonstrate graphically and explain verbally the difference
Q138: The table below shows the data
Q140: Explain why Canada's labour force has grown
Unlock this Answer For Free Now!
View this answer and more for free by performing one of the following actions

Scan the QR code to install the App and get 2 free unlocks

Unlock quizzes for free by uploading documents