The first graph below is for Chic and Sharpe Ltd., a firm in the women's garment industry, which is monopolistically competitive.
a) Label the four curves in the first graph. 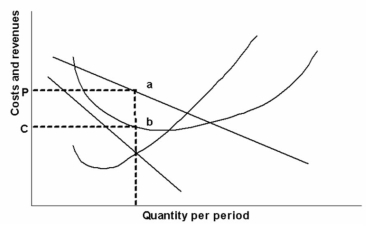
b) What areas in the graph above represent: total cost: total revenue; and economic profit?
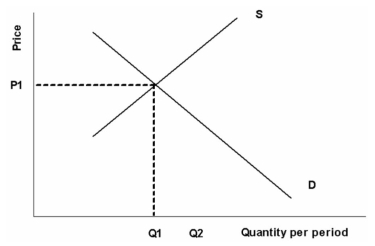
c) On the second graph below, sketch in the effect of entry by new firm's into this industry and label the new price and quantity traded as P2 and Q2
d) Using the average/marginal cost curves in the third graph below, sketch in the firm's new demand and marginal revenue curves that would be consistent with zero economic profits. Label the equilibrium price and quantity traded as P2f and Q2f
e) On the third graph indicate with Qc the capacity output for the firm.
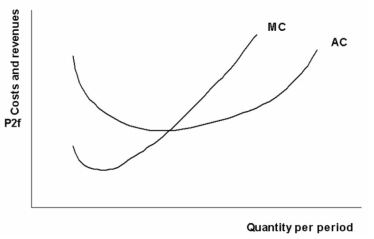
f) What is the amount of excess capacity for this firm?
Correct Answer:
Verified
View Answer
Unlock this answer now
Get Access to more Verified Answers free of charge
Q124: "Since monopolistically competitive firms do not earn
Q126: Draw a linear demand curve,marginal revenue curve,marginal
Q128: Define 'concentration ratio' and describe how can
Q129: Draw a linear demand curve,marginal revenue curve,marginal
Q130: Why do firms advertise?
Q132: The actual owners of most oligopoly firms
Q134: "In an oligopoly and monopolistically competitive market
Q135: What are the main features of an
Q138: From 1990 to 2005,what manufacturing industry has
Q139: Explain why monopolistically competitive firms franchise?
Unlock this Answer For Free Now!
View this answer and more for free by performing one of the following actions

Scan the QR code to install the App and get 2 free unlocks

Unlock quizzes for free by uploading documents