From the TI- 84 graphing calculator screenshots below, choose the screenshot whose shaded area correctly depicts the following hypothesis test results: H0: p = 0.25, Ha: p > 0.25, a = 0.05, z = 2.01, p- value = 0.022
A) 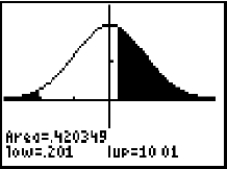
B) 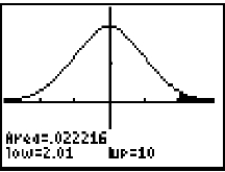
C) 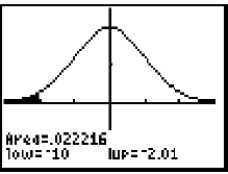
Correct Answer:
Verified
Q30: Use the following information to answer the
Q31: A polling agency is interested in testing
Q32: Suppose a city official conducts a hypothesis
Q33: A research firm carried out a hypothesis
Q34: A researcher believes that children who attend
Q36: A researcher believes that the reading habits
Q37: Read the following problem description then choose
Q38: Which of the following is not one
Q39: Which of the following is not true
Q40: Read the following problem description then choose
Unlock this Answer For Free Now!
View this answer and more for free by performing one of the following actions

Scan the QR code to install the App and get 2 free unlocks

Unlock quizzes for free by uploading documents