The data in the table represent the amount of raw material (in tons) put into an injection molding machine each day (x) , and the amount of scrap plastic (in tons) that is collected from the machine every four weeks (y) . Also shown below are the outputs from two different statistical technologies (TI- 83/84 Calculator and Excel) . A scatterplot of the data confirms that there is a linear association. Report the equation for predicting scrap from raw material using words such as scrap, not x and y. State the slope and intercept of the prediction equation. Round all calculations to the nearest hundredth. 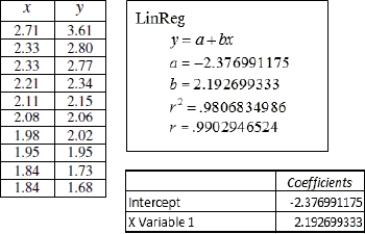
A) scrap = - 2.38 + 2.19(raw material) ; slope = 2.19 and the intercept is - 2.38.
B) scrap = 2.19 - 2.38(raw material) ; slope = - 2.38 and the intercept is 2.19.
C) scrap = 2.19 - 2.38(raw material) ; slope = 2.19 and the intercept is - 2.38.
D) scrap = - 2.38 + 2.19(raw material) ; slope = - 2.38 and the intercept is 2.19.
Correct Answer:
Verified
Q10: Use the following information to answer the
Q11: r = 0.8670 Q12: It is determined that a positive linear Q13: The following calculator screenshots show the scatterplot Q14: Which of the following statements regarding the
A) ![]()

