The table shows the number of minutes ridden on a stationary bike and the approximate number of calories burned. Plot the points on the grid provided then choose the most likely correlation coefficient from the answer choices below. 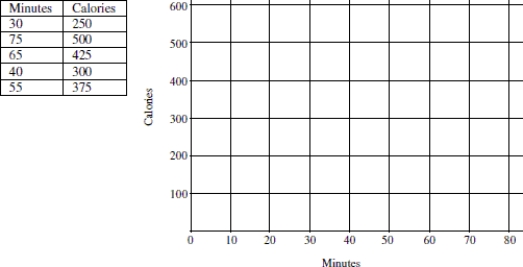
A) - 0.99
B) - 0.20
C) 0.20
D) 0.99
Correct Answer:
Verified
Q1: The scatterplot below shows the number of
Q2: Suppose it has been established that "annual
Q4: Use the following information to answer the
Q5: Doctors believe that smoking cigarettes inflames the
Q6: Use the following information to answer the
Q7: What key things should you look for
Q8: A veterinarian is going to investigate whether
Q9: It is determined that a positive linear
Q10: Use the following information to answer the
Q11: r = 0.8670
A) ![]()
Unlock this Answer For Free Now!
View this answer and more for free by performing one of the following actions

Scan the QR code to install the App and get 2 free unlocks

Unlock quizzes for free by uploading documents