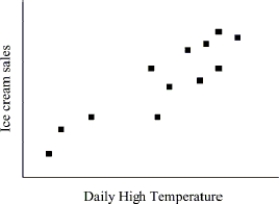
The scatterplot below shows the ice cream sales and daily high temperatures for a three week period of time during the summer. Does there appear to be an association between these two variables? If so, describe the pattern. Be sure to comment on trend, shape, and the strength of the association.
Correct Answer:
Verified
View Answer
Unlock this answer now
Get Access to more Verified Answers free of charge
Q43: Explain in your own words what extrapolation
Q44: Use the following information to answer the
Q45: State the explanatory variable and the response
Q46: If the correlation between whole milk content
Q47: Use the data provided in the table
Q49: The following regression equation was found to
Q50: Use the regression equation to predict how
Q51: A horticulturist conducted an experiment on 120
Q52: Use the following information to answer the
Q53: State the slope and intercept of the
Unlock this Answer For Free Now!
View this answer and more for free by performing one of the following actions

Scan the QR code to install the App and get 2 free unlocks

Unlock quizzes for free by uploading documents