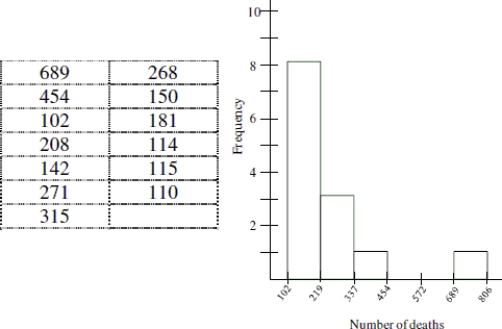
Use the following information to answer the question. Here is a table recording the number of deaths for the top thirteen worst U.S. tornados since 1925. A histogram showing the distribution is also included.
-Estimate the most appropriate measure of variability.
A) Standard Deviation; 178.5
B) Standard Deviation; 169.4
C) IQR; 156
D) IQR; 574
Correct Answer:
Verified
Q9: The mean price of a pound of
Q10: The following list shows the age at
Q11: Between what two values would you expect
Q12: In 2007, the mean price per pound
Q13: A city planner says, "The typical commute
Q15: The following list shows the age at
Q16: Use the following information to answer the
Q17: Use the following information to answer the
Q18: Using the boxplot for the West, determine
Q19: Use the following information to answer the
Unlock this Answer For Free Now!
View this answer and more for free by performing one of the following actions

Scan the QR code to install the App and get 2 free unlocks

Unlock quizzes for free by uploading documents