Data were collected on hand grip strength of adults. The histogram below summarizes the data. Which statement is true about the distribution of the data shown in the graph? 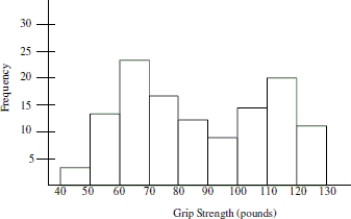
A) There must have been a mistake made in data collection because the distribution should be bell- shaped.
B) The graph shows evidence that two different groups may have been combined into one collection.
C) The best estimate of typical grip strength is 80- 90 pounds because it is in the center of the distribution.
D) The graph is useless because it is bimodal.
Correct Answer:
Verified
Q9: A group of junior high athletes was
Q10: A collection of twenty college students was
Q11: Data was collected on the heights of
Q12: For twenty days a record store owner
Q13: The distribution of test scores for a
Q15: Which category shows the least amount of
Q16: What was the most common response for
Q17: How many participants had a heart rate
Q18: A collection of twenty college students was
Q19: The following graphic was used to visually
Unlock this Answer For Free Now!
View this answer and more for free by performing one of the following actions

Scan the QR code to install the App and get 2 free unlocks

Unlock quizzes for free by uploading documents