A group of junior high athletes was asked what team sport was their favorite. The data are summarized in the table below. On the pie chart, which area would correspond to the category "Soccer"? 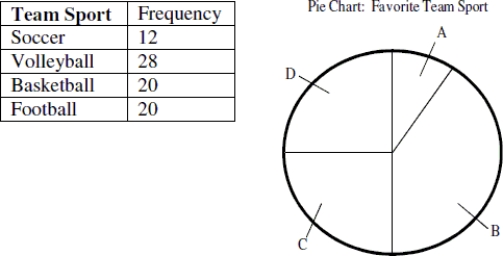
A) Area A
B) Area B
C) Area C
D) Area D
Correct Answer:
Verified
Q2: Find the original data set from the
Q3: Based on the histogram below, would it
Q4: Each day for twenty days a record
Q5: The distribution of heights of adult males
Q6: The following graphic was used to visually
Q8: How many participants had a heart rate
Q9: A group of junior high athletes was
Q10: A collection of twenty college students was
Q11: Data was collected on the heights of
Q12: For twenty days a record store owner
Unlock this Answer For Free Now!
View this answer and more for free by performing one of the following actions

Scan the QR code to install the App and get 2 free unlocks

Unlock quizzes for free by uploading documents