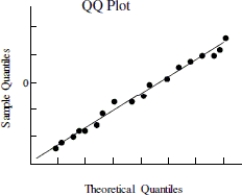
Use the following information to answer the question. Below is the scatterplot showing the association between the number of workers on an assembly team (x), and the number of parts assembled in an 8- hour shift (y). The residual plot of the data is also shown along with a QQ plot of the residuals.
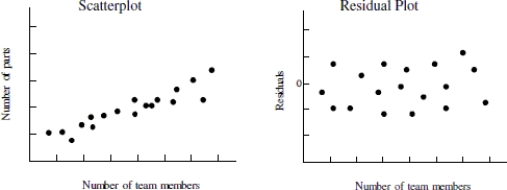
-Use the plot(s)above to explain whether the condition for linearity is satisfied.
Correct Answer:
Verified
View Answer
Unlock this answer now
Get Access to more Verified Answers free of charge
Q14: Explain how a residual plot can be
Q42: Use the following information to answer the
Q43: Test the hypothesis that the slope is
Q45: Explain what residuals are. Where do residuals
Q46: Suppose that you were presented with data
Q48: Use the following information to answer the
Q49: Researchers studying the relationship between the number
Q50: Use the following information to answer the
Q51: Use the following information to answer the
Q52: The regression output below is the result
Unlock this Answer For Free Now!
View this answer and more for free by performing one of the following actions

Scan the QR code to install the App and get 2 free unlocks

Unlock quizzes for free by uploading documents