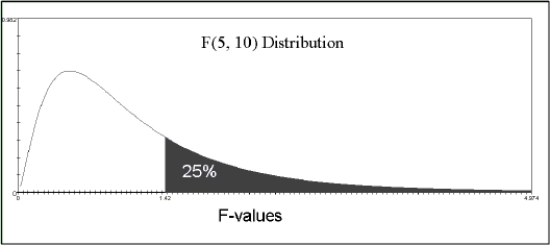
The figure below shows the F- distribution with 5 and 10 degrees of freedom to test the hypothesis that age groups and reading speed are associated. The shaded area represents the p- value. Assume that all conditions for ANOVA have been met. Should the null hypothesis that the age group population means are equal be rejected? What conclusion can be drawn about the association between age group and reading speed?
Correct Answer:
Verified
View Answer
Unlock this answer now
Get Access to more Verified Answers free of charge
Q7: Describe two of the four conditions that
Q11: In the context of the ANOVA test,
Q45: Use the following information to answer the
Q47: A television studio did a poll to
Q48: Use the following information to answer the
Q49: Use the following information for the questions.
Q53: Suppose you have observations from six different
Q55: Suppose you have observations from six different
Q93: Adult drink
A particular study claims that
Q93: Adult drink
A particular study claims that
Unlock this Answer For Free Now!
View this answer and more for free by performing one of the following actions

Scan the QR code to install the App and get 2 free unlocks

Unlock quizzes for free by uploading documents