Use the following information to answer the question. The data in the top row of the table shows the number of vacation days taken by the respondent in the previous 90 days. The respondents also reported their level of happiness; Very H means very happy, and so on.
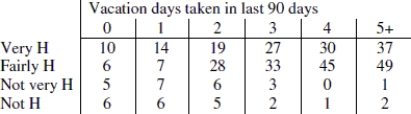
-The following table shows the data after merging categories so that there are two column categories (0- 1 vacation days and 2 or more vacation days) , and two row categories (happy and unhappy) . Expected values for each cell are also shown in parentheses. Test the hypothesis that there is an association between happiness and number of vacation days taken in the last 90 days, using a significance level of 0.05. State the value of the test statistic rounded to two decimal places and state whether the p- value is closer to zero or one. 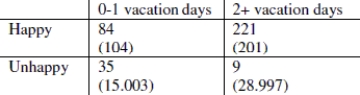
A) ç2 = 5.03; The p- value will be close to zero.
B) ç2 = 46.28; The p- value will be close to one.
C) ç2 = 5.03; The p- value will be close to one.
D) ç2 = 46.28; The p- value will be close to zero.
Correct Answer:
Verified
Q1: Choose the statement that is not true
Q8: Use the following information to answer the
Q9: Suppose a study was conducted to see
Q10: A health foods store owner is thinking
Q11: Choose the statement that is not true
Q12: The following table shows the results from
Q14: Use the following information to answer the
Q15: Use the following information to answer the
Q16: Use the following table to answer the
Q17: Choose the statement that is not true
Unlock this Answer For Free Now!
View this answer and more for free by performing one of the following actions

Scan the QR code to install the App and get 2 free unlocks

Unlock quizzes for free by uploading documents