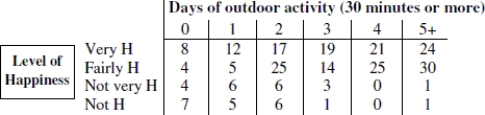
Use the following information to answer the question. The data in the top row of the table shows the number of days for which the respondent participated in an outdoor activity for at least thirty minutes in the previous 60 days. The respondents also reported their level of happiness; Very H means very happy, and so on.
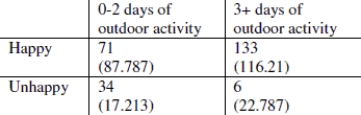
-The following table shows the data after merging categories so that there are two column categories (0- 2 days of outdoor activity of at least thirty minutes and 3 or more days of outdoor activity of at least thirty minutes), and two row categories (happy and unhappy). Expected values for each cell are also shown in parenthesis. Test the hypothesis that there is an association between happiness and with level of daily outdoor activity in the last 60 days, using a significance level of 0.05. State the value of the test statistic rounded to two decimal places, state whether the p- value is closer to zero or one.
Correct Answer:
Verified
View Answer
Unlock this answer now
Get Access to more Verified Answers free of charge
Q5: Suppose a random sample of 1,105 adults
Q7: Suppose a researcher was interested in learning
Q17: Describe at least one advantage and one
Q18: Suppose a goodness-of-fit test is used to
Q51: Use the following information to answer the
Q52: Use the following table to answer the
Q54: Use the following information to answer the
Q55: Use the following table to answer the
Q57: The following table shows the results from
Q59: Use the following information to answer the
Unlock this Answer For Free Now!
View this answer and more for free by performing one of the following actions

Scan the QR code to install the App and get 2 free unlocks

Unlock quizzes for free by uploading documents