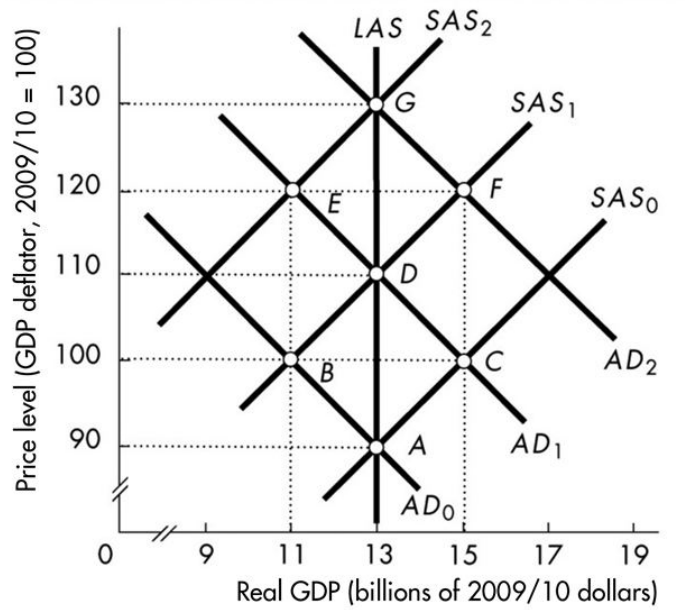
-In the above figure, which path represents a cost- push inflation?
A) Point A to B to D to F to G
B) Point A to B to D to E to G
C) Point A to C to D to F to G
D) Point A to C to D to E to G
Correct Answer:
Verified
Q4: An initial increase in aggregate demand that
Q5: An increase in the expected inflation rate
Q6: The new classical cycle theory predicts that
Q7: Which of the following is NOT one
Q8: Which of the following could lead to
Q11: If the real interest rate is 2
Q13: Cost- push inflation can be started by
A)a
Q14: Cost- push inflation starts with
A)a decrease in
Q25: If an economy at potential GDP experiences
Q171: If the natural unemployment rate increases, then
Unlock this Answer For Free Now!
View this answer and more for free by performing one of the following actions

Scan the QR code to install the App and get 2 free unlocks

Unlock quizzes for free by uploading documents