Multiple Choice
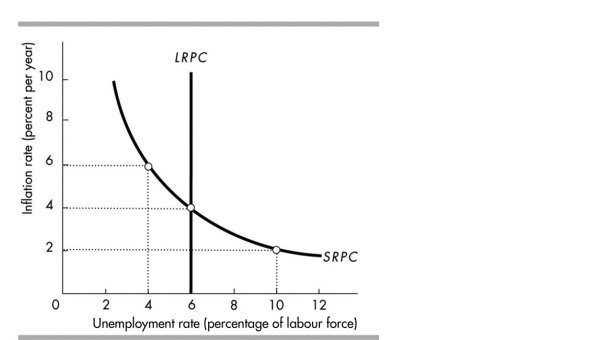
-The figure above shows an economy's Phillips curves. Currently, the inflation rate is 6 per cent a
year. The natural unemployment rate is ________ per cent and the expected inflation rate is
________ per cent a year.
A) 6; 4
B) 4; 6
C) 6; 6
D) 6; 10
Correct Answer:
Verified
Related Questions
Q64: "Intertemporal substitution" in labour supply describes changes
Q65: In Australia, when both the unemployment rate
Q66: In monetarist business cycle theory, decreasing
Q67: run Phillips curve shows the tradeoff between
Unlock this Answer For Free Now!
View this answer and more for free by performing one of the following actions

Scan the QR code to install the App and get 2 free unlocks

Unlock quizzes for free by uploading documents