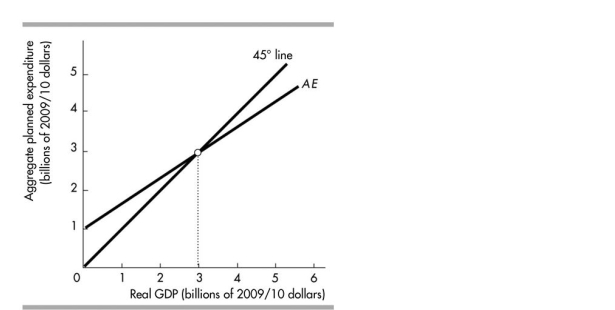
- The figure shows Tropical Isle's aggregate planned expenditure curve. When aggregate planned
expenditure is $2 billion, aggregate planned expenditure is ________ than real GDP, firms' inventories ________, and firms ________ their production.
A) less; increase; decrease
B) greater; decrease; increase
C) less; decrease; increase
D) greater; increase; decrease
Correct Answer:
Verified
Q44: An increase in _ shifts the AE
Q45: Which of the following makes the multiplier
Q46: Q47: Australia's consumption function Q48: The size of the multiplier Unlock this Answer For Free Now! View this answer and more for free by performing one of the following actions Scan the QR code to install the App and get 2 free unlocks Unlock quizzes for free by uploading documents![]()
A)has a positive slope.
B)has shifted
A)is unaffected by

