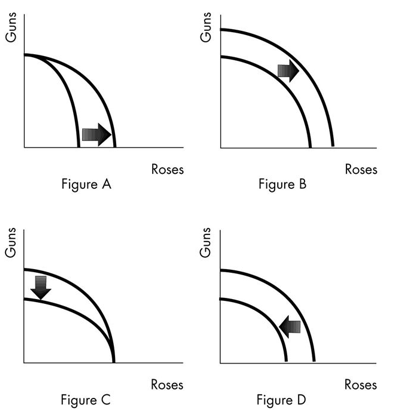
-Based on the above diagram, which figure shows the impact of a decrease in the population available to work?
A) Figure B
B) Figure C
C) Figure D
D) Figure A
Correct Answer:
Verified
Q11: The production possibilities frontier
A) depicts the boundary
Q93: A person has a comparative advantage in
Q94: Which of the following is true regarding
Q95: The production possibilities frontier is
A)upward sloping and
Q96: A country possesses a comparative advantage in
Q99: In order for societies to reap the
Q100: In one day, Sue can change the
Q102: Which of the following describes comparative advantage?
A)Firm
Q103: Increasing opportunity cost occurs along a production
Q324: ![]()
Unlock this Answer For Free Now!
View this answer and more for free by performing one of the following actions

Scan the QR code to install the App and get 2 free unlocks

Unlock quizzes for free by uploading documents