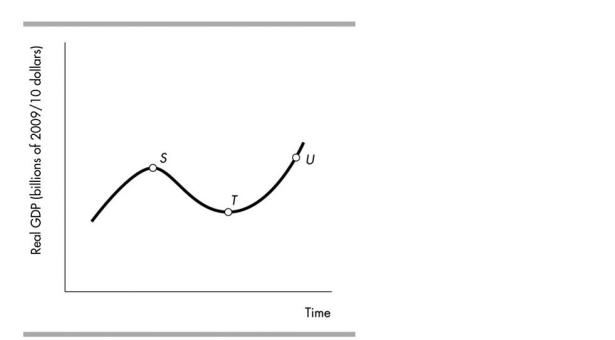
-In the above figure, the distance between points S and T represents
A) a peak.
B) a trough.
C) an expansion.
D) a recession.
Correct Answer:
Verified
Q14: In the definition of GDP, ʺmarket valueʺ
Q24: The factor market can BEST be described
Q25: The circular flow model shows that consumer
Q26: In part, the underground economy exists because
Q27: Which of the following would lead GDP
Q28: The maximum amount of production that can
Q30: _ is gross investment minus _.
A)The
Q33: GDP is defined as the market value
Q34: The word "final" in the definition of
Q43: GDP equals
A) C + S + G
Unlock this Answer For Free Now!
View this answer and more for free by performing one of the following actions

Scan the QR code to install the App and get 2 free unlocks

Unlock quizzes for free by uploading documents