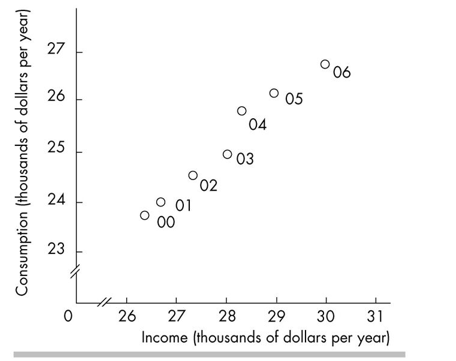
-In the above figure, the axis breaks are used
A) to indicate that there are jumps from the origin, 0, to the first values recorded along the axes.
B) to show that there are no data available for the omitted ranges.
C) to create a misleading graph.
D) to indicate that there are not enough data to be included in the graph.
Correct Answer:
Verified
Q13: Q14: Q15: Which of the following is an example Q16: Q17: Marginal cost is the Q19: The loss of the highest- valued alternative Q20: Which of the following is a normative Q21: Which of the following is a macroeconomic Unlock this Answer For Free Now! View this answer and more for free by performing one of the following actions Scan the QR code to install the App and get 2 free unlocks Unlock quizzes for free by uploading documents![]()
![]()
![]()
A)total cost of an

