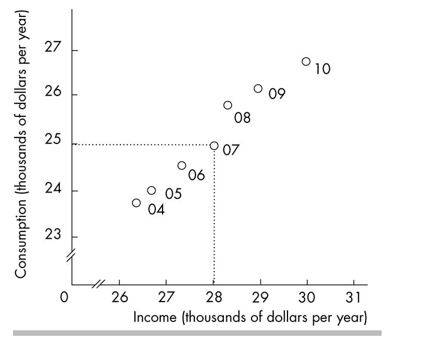
-The above figure plots income and consumption in a nation. In 2007
A) consumption was equal to $28,000 and income was equal to $25,000.
B) consumption was equal to $25,000 and income was equal to $25,000.
C) consumption was equal to $27,000 and income was equal to $31,000.
D) consumption was equal to $25,000 and income was equal to $28,000.
Correct Answer:
Verified
Q110: Which of the following is a positive
Q111: Ceteris paribus when graphing a relationship refers
Q112: Q113: The slope of a line equals the Q114: Keeping in mind economists' definition of factors Q116: Scarcity is a situation in which Q117: A cost due to an increase in Q118: A good economic model![]()
A)change
A)people can
A)includes only those features
Unlock this Answer For Free Now!
View this answer and more for free by performing one of the following actions

Scan the QR code to install the App and get 2 free unlocks

Unlock quizzes for free by uploading documents