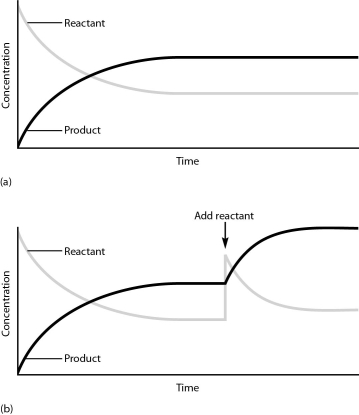
-Chemical equilibrium and the law of mass action are illustrated in Figure 3.1. The law of mass action is critical in physiological processes, because concentrations of reactants and products in cells and body fluids are constantly changing. Based on this information, what does the slope of the curve represent in graphs a and b?
Correct Answer:
Verified
View Answer
Unlock this answer now
Get Access to more Verified Answers free of charge
Q158: The organ that stores glucose as glycogen
Q159: Potential energy describes the energy possessed by
Q160: Energy -releasing reactions occur spontaneously.
Q161: Complete oxidation of 1 mole glucose produces
Q162: Lactate dehydrogenase is an enzyme in the
Q164: ATP stores energy.
Q165: All of the energy released by the
Q166: Addition of a phosphate group to an
Q167: Describe the process whereby energy is obtained
Q168: ![]()
Unlock this Answer For Free Now!
View this answer and more for free by performing one of the following actions

Scan the QR code to install the App and get 2 free unlocks

Unlock quizzes for free by uploading documents