The population N, in thousands, of a certain city t years after 2000 is given by 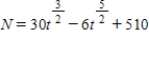 . The formula is valid over a 10-year period.Over what period was the population decreasing? A graph of N versus t can help you answer this question.
A) From 2003 to 2010
B) From 2004 to 2010
C) From 2000 to 2003
D) From 2000 to 2004
Correct Answer:
Verified
Q27: Make the graph of Q28: When a car skids to a stop, Q29: Sketch a graph that is increasing and Q30: Make the graph of Q31: Make the graph of Q32: Make the graph of Q34: Make the graph of Q35: The life expectancy E, in solar lifetimes, Q36: Make the graph of Q37: Make the graph of Unlock this Answer For Free Now! View this answer and more for free by performing one of the following actions Scan the QR code to install the App and get 2 free unlocks Unlock quizzes for free by uploading documents![]()
![]()
![]()
![]()
![]()
![]()
![]()

