Multiple Choice
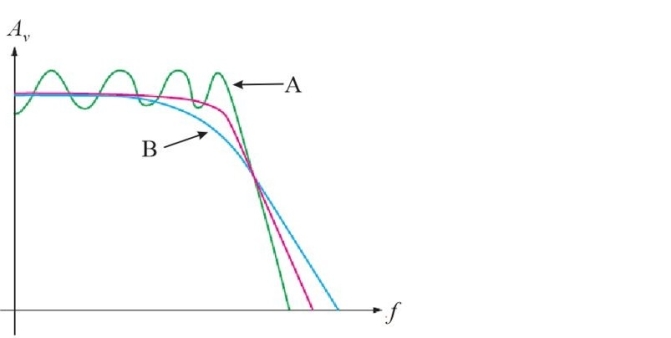 Figure 5 Response curve for three different filters
-Refer to Figure 5. The response labeled "A" represents a
A) Butterworth response
B) Bessel response
C) Chebyshev response
D) none of the above
Correct Answer:
Verified
Related Questions

