According to the data presented in the graph, between 1960 and 2000, CO 2 levels rose approximately__________ ppm. 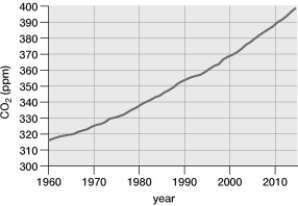
A) 320
B) 50
C) 370
D) 20
E) 70
Correct Answer:
Verified
Q106: What would happen if there were no
Q107: On a field trip with your class
Q108: Why might eating high on the food
Q109: There is a school of thought that
Q110: What are some possible consequences of global
Q112: If you were a researcher trying to
Q113: Nitrogen is fixed by soil bacteria and
Q114: The global phosphorus cycle is called a
Q115: Why is phosphorus so important to living
Q116: Plants cannot fix nitrogen, but legumes are
Unlock this Answer For Free Now!
View this answer and more for free by performing one of the following actions

Scan the QR code to install the App and get 2 free unlocks

Unlock quizzes for free by uploading documents