This graph, which is based on estimates from the International Panel on Climate Change (IPCC) , shows that by 2100, global temperatures may rise as much as __________above average levels in 2000. The dashed data line represents a high growth of greenhouse gas, the dotted data line represents a moderate growth of greenhouse gas, and the square data line represents a substantially reduced growth of greenhouse gas. 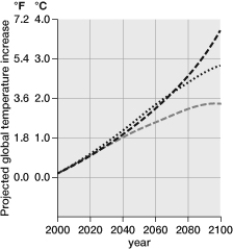
A) 3°C
B) 2.5°C
C) nearly 4°C
D) 1°C
E) nearly 2°C
Correct Answer:
Verified
Q96: Herbivores occupy the trophic level of_ consumer.
Q97: Ornithologists have noted that Mexican Jays in
Q98: What would happen in an ecosystem without
Q99: Grasses and phytoplankton are _.
Q100: The primary reservoir for the nutrient_ is
Q102: Plants produce biomass by taking in energy,
Q103: Why is it so hard to make
Q104: It has been said about global warming
Q105: A rancher begins raising sheep on the
Q106: What would happen if there were no
Unlock this Answer For Free Now!
View this answer and more for free by performing one of the following actions

Scan the QR code to install the App and get 2 free unlocks

Unlock quizzes for free by uploading documents