Multiple Choice
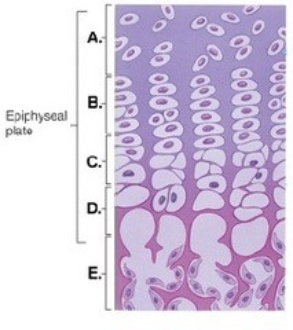
-This figure illustrates bone growth in length at the epiphyseal plate. Zone "E" represents
A) bone tissue of the diaphysis.
B) zone of calcification.
C) zone of hypertrophy.
D) zone of proliferation.
E) zone of resting cartilage.
Correct Answer:
Verified
Related Questions
Q142: Name the air-filled spaces lined by mucous
Q143: Q144: Q145: Bones that are thin and have a Q146: Q148: Q149: Bones that are longer than they are Q150: During development, some bones arise from thick Q151: The two types of bone development formation Q152: Unlock this Answer For Free Now! View this answer and more for free by performing one of the following actions Scan the QR code to install the App and get 2 free unlocks Unlock quizzes for free by uploading documents![]()
![]()
![]()
![]()
![]()

