Use the following pair of graphs, which illustrate the market for corn which is used to produce corn-based ethanol) and a representative firm, to answer the following questions.
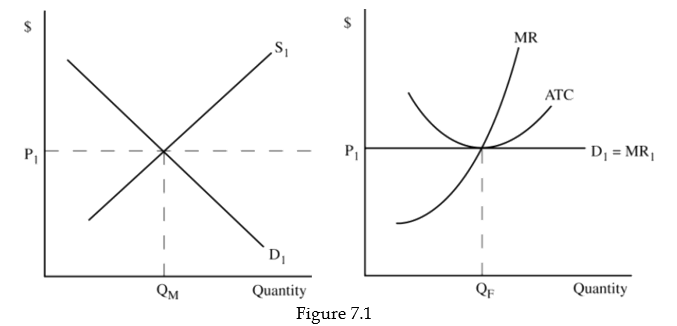
a. Assume policymakers pass a law requiring that all gas sold in the United States contain at least 10 percent corn-based ethanol. In the graphs above, illustrate the short-run effects of this law. In particular, show how the law would affect
• the short-run equilibrium in the market for corn,
• the short-run demand curve faced by the representative firm, and
• the representative firm's short-run profit-maximizing level of output. Label the new curves and equilibrium values using a subscript 2.
b. Next, graphically illustrate how, after the initial changes you illustrated in question 7, the corn market and the representative firm would adjust back to long-run equilibrium. Label any new curves and equilibrium values using a subscript 3. After all adjustments have taken place, what has happened to the equilibrium market price, the number of firms operating in the market, and the representative firm's profits? Why?
Correct Answer:
Verified
View Answer
Unlock this answer now
Get Access to more Verified Answers free of charge
Q89: There is an inverse relationship between the
Q91: Explain why a firm should continue to
Q94: Assume the market for a good produced
Q97: The estimated price-cost margin of 11.9 percent
Q99: Assume there is a decrease in the
Q101: Explain why,when all adjustment have taken place,the
Q102: Assume the production technology changes for a
Q103: Fill in the blanks to complete the
Q104: Assume a perfectly competitive firm is currently
Q106: Assume the government decides to impose a
Unlock this Answer For Free Now!
View this answer and more for free by performing one of the following actions

Scan the QR code to install the App and get 2 free unlocks

Unlock quizzes for free by uploading documents