Multiple Choice
Figure 4-6
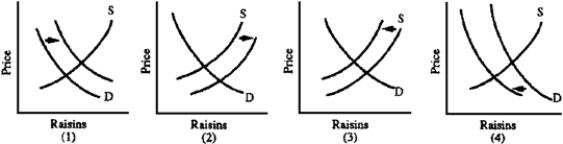
-Grapes can be used for wine or for raisins.Which graph in Figure 4-6 best depicts the effects on the U.S.raisin market of a decrease in purchases of domestic wines?
A) 1
B) 2
C) 3
D) 4
Correct Answer:
Verified
Related Questions
Q161: Along a supply curve,
A)supply changes as price
Q180: If price rises, what happens to quantity
Q181: The price of one good produced by
Q183: Pork can be used to produce bacon
Q185: From 2007 to 2008, the Federal Reserve
Unlock this Answer For Free Now!
View this answer and more for free by performing one of the following actions

Scan the QR code to install the App and get 2 free unlocks

Unlock quizzes for free by uploading documents