In the following diagram, the curve 0ABC that relates the market value of LDC external Debt to the face value of the external debt is known as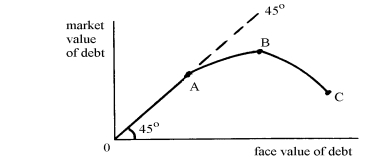
A) the Laffer curve.
B) the debt-relief Laffer curve.
C) the Brady curve.
D) the Prebisch-Singer curve.
Correct Answer:
Verified
Q12: If the demand curve for a good
Q13: In the diagram in Question #13 above,
Q14: Remembering the optimum tariff analysis of Chapter
Q15: In attempting to determine whether a developing
Q16: In the diagram in Question #13 above,
Q18: Which one of the following has NOT
Q19: In the context of developing countries' external
Q20: In the situation of transfer pricing by
Q21: The income elasticity of demand for manufactured
Q22: Other things equal, an export quota agreement
Unlock this Answer For Free Now!
View this answer and more for free by performing one of the following actions

Scan the QR code to install the App and get 2 free unlocks

Unlock quizzes for free by uploading documents