The graph shown below depicts the hormonal changes that occur during the female reproductive cycle. Day one on this graph represents the onset of menses. Based on what you know about the events induced by the hormones shown in the graph, on what day would you predict that ovulation would occur? 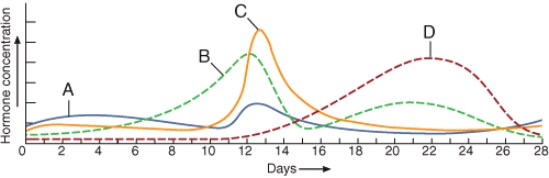
A) Day 1
B) Day 6
C) Day 12
D) Day 14
E) Day 26
Correct Answer:
Verified
Q77: During early fetal development, germ cells in
Q78: Estrogens and testosterone stimulate the development of
Q79: Even though males have a decline in
Q80: The mucosa of the vagina contains large
Q81: Mifepristone, also known as miniprex or RU
Q83: Describe the role that sustentacular (Sertoli)cells play
Q84: Increased secretion of the hormone labeled _
Q85: Which of the following answer selections is
Q86: The structure labeled D in the diagram
Q87: Name and explain the functions of the
Unlock this Answer For Free Now!
View this answer and more for free by performing one of the following actions

Scan the QR code to install the App and get 2 free unlocks

Unlock quizzes for free by uploading documents